The BPA ROI Reality Check: What the Numbers Actually Say
Business process automation (BPA) has crossed the chasm from early adoption to mainstream necessity. As of 2023, 72% of organizations had adopted BPA tools, up from 58% in 2020, according to data compiled by Gitnux. The global BPA market is projected to reach $22.45 billion in 2026 and grow to $54.34 billion by 2032, per Fortune Business Insights. Those are impressive headline numbers — but they mask a more uncomfortable truth.
This tension — high adoption, low satisfaction — is the real starting point for any serious ROI conversation. The potential is enormous: Forrester data, cited by Gitnux, shows that BPA projects deliver an average ROI of 200–300% within 12–18 months, and implementations reduce process cycle times by an average of 58%. But those returns are not automatic. They depend on three measurable factors that most organizations never quantify before they start.
The Three Factors That Determine Whether Automation Pays Off
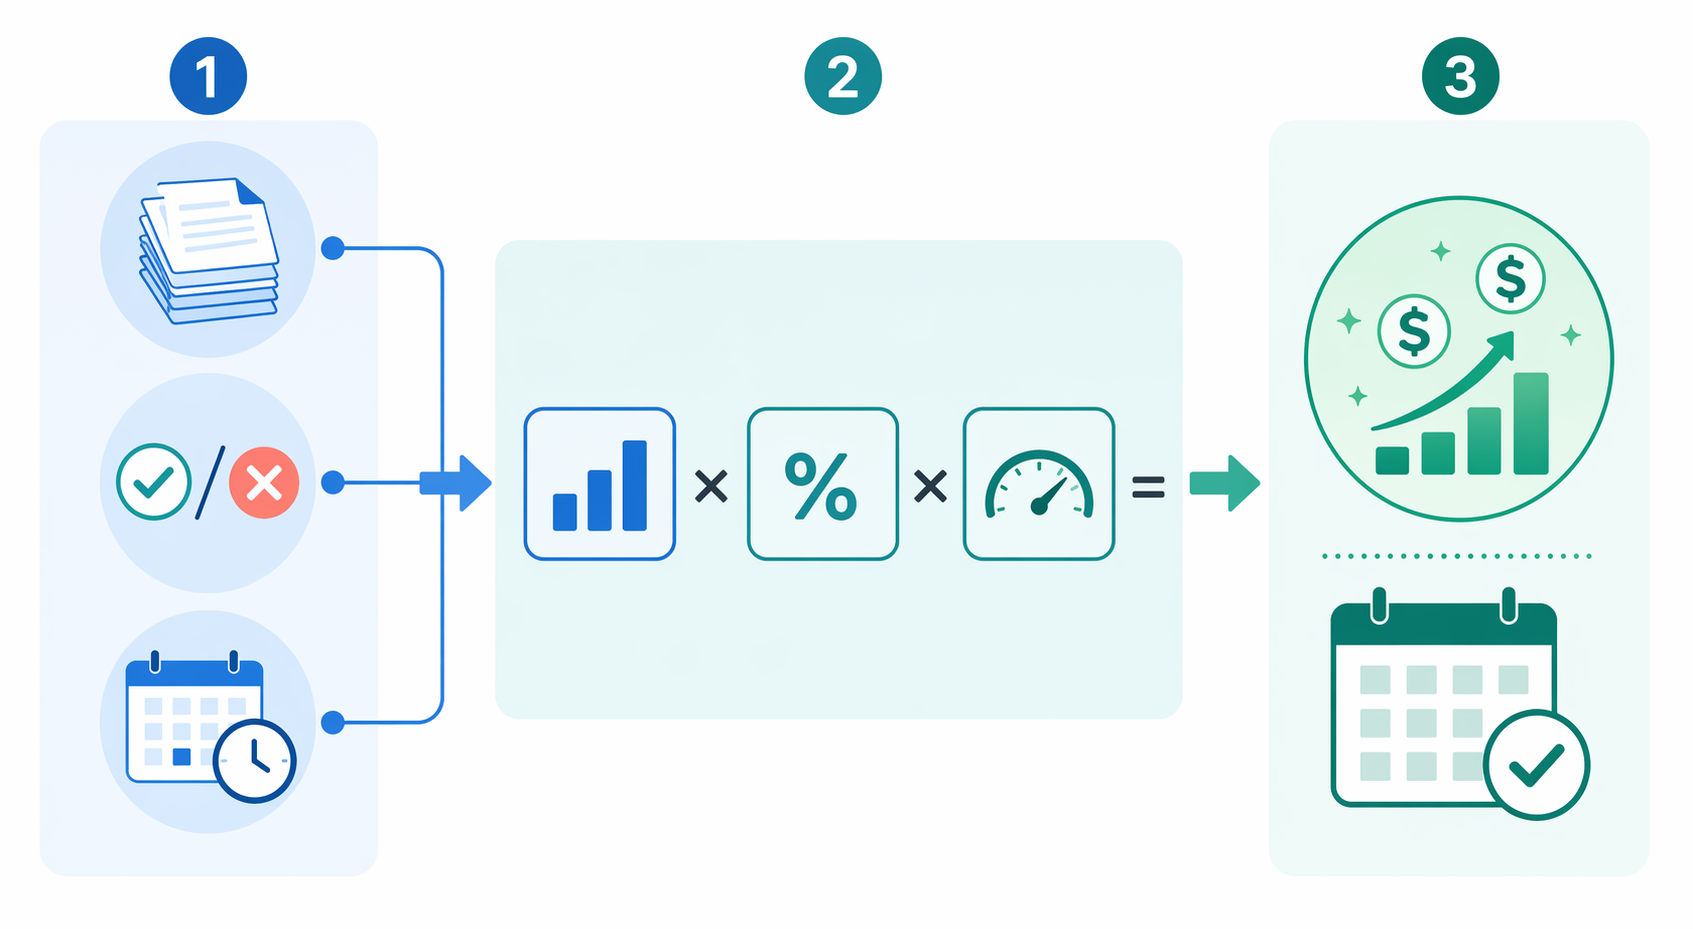
After analyzing dozens of case studies and vendor benchmarks, a clear pattern emerges. ROI is not a function of which tool you choose. It is a function of three process-level variables:
- Process volume. How many times per month does this task repeat? High-volume processes (500+ invoices, 200+ support tickets, 100+ onboarding forms) generate the largest absolute savings because every minute saved is multiplied by the frequency.
- Error rate before automation. Manual data entry, approval handoffs, and cross-system copying produce predictable error rates. BPA reduces manual errors by an average of 40% (Gitnux). The higher your current error rate, the larger the savings from eliminating rework, corrections, and compliance failures.
- Approval cycle speed. Processes that require sequential approvals — invoice sign-offs, purchase orders, employee onboarding checklists — are where automation delivers its most dramatic gains. BPA cuts invoice approval from days to hours, a 3.5x speed improvement on average (Gitnux).
When these three factors align — high volume, high error rate, slow approvals — organizations consistently report positive ROI within 30–60 days of their first deployment, according to Stepper's analysis of real-world implementations. When any one factor is weak, the payback period stretches and the risk of disappointment rises.

The True Cost of Manual Work: Bottlenecks, Errors, and Lost Time
Before building a business case for automation, it helps to quantify the cost of doing nothing. Manual processes carry hidden expenses that rarely appear on a P&L statement but drain budgets month after month.
The Productivity Drain
Employee productivity increases by 25–50% after BPA deployment, according to directional data from Gitnux. That range implies that before automation, knowledge workers spend a quarter to half of their time on tasks that could be handled by software — data entry, report generation, status checking, cross-system copying. For a team of ten people earning $60,000 per year on average, a 30% productivity loss represents roughly $180,000 in annual wasted labor cost.
Error Costs Add Up Faster Than You Think
Manual data entry and approval processes generate errors that cascade through downstream systems. A single incorrect invoice number can delay payment by weeks. A misrouted purchase order can halt a production line. Workflow automation reduces processing errors by as much as 70% (Gitnux via 2am.tech). The cost of those errors — rework labor, late fees, lost discounts, compliance penalties — is often the largest line item in a manual process that no one has ever calculated.
| Cost Category | Manual Process | Automated Process | Annual Impact (Est.) |
|---|---|---|---|
| Labor per transaction | 15 min at $30/hr | 2 min at $30/hr | $6,500 saved per 1,000 transactions |
| Error rate | 3–5% of transactions | <1% of transactions | Varies by process; 40% avg reduction |
| Cycle time (invoice approval) | 3–5 days | 4–6 hours | 3.5x faster (Gitnux) |
| Employee productivity | 50–75% on value-add work | 75–95% on value-add work | 25–50% improvement (Gitnux) |
The table above uses conservative estimates. In practice, organizations that automate high-volume processes report average annual savings of around $46,000 per organization after adopting BPA solutions (2am.tech). For larger enterprises with multiple high-volume processes, the figure scales proportionally.
ROI by the Numbers: What Research Reveals About Real-World Returns
The following statistics form the data backbone of any BPA business case. They come from multiple sources — Gitnux (which applies a confidence rating system), Stepper, and 2am.tech — and should be cited with appropriate caveats about methodology and source bias.
| Metric | Value | Source | Confidence |
|---|---|---|---|
| Average ROI from BPA projects | 200–300% within 12–18 months | Forrester (via Gitnux) | Verified |
| Process cycle time reduction | 58% average | Verified (via Gitnux) | Verified |
| Reduction in manual errors | 40% average across automated processes | Gitnux | Verified |
| Operational cost reduction within 6 months | 28% for 80% of BPA users | Gitnux | Verified |
| Employee productivity increase | 25–50% post-deployment | Gitnux | Directional |
| Process execution speed improvement | 3.5x faster on average | Gitnux | Verified |
| Organizations reporting positive ROI within 12 months | Nearly 60% | 2am.tech | Single source |
| Average annual savings per organization | ~$46,000 | 2am.tech | Single source |
| IT leaders reporting 50%+ process time reduction | 73% | 2am.tech | Single source |
| AI + RPA combined ROI increase (first year) | 30–200% | 2am.tech | Directional |
The most important takeaway from this data is the consistency of the direction. Every source — vendor blogs, independent research firms, and aggregated statistics — points to the same conclusion: BPA delivers measurable, significant returns when applied to the right processes. The variation is in the magnitude, not the existence, of the ROI.
How to Calculate Your Automation ROI: A Repeatable Formula
Rather than relying on vendor-provided ROI calculators (which tend to assume best-case scenarios), you can build your own calculation using a straightforward four-step formula. This approach works for any process and gives you defensible numbers to present to stakeholders.
Step 1: Calculate Current Manual Cost
For a given process, estimate the total monthly hours spent on manual work and multiply by the fully loaded hourly rate of the people doing it.
Manual Labor Cost = (Hours per transaction × Transaction volume per month) × Fully loaded hourly rateStep 2: Estimate Error-Related Costs
Identify the most common error types in the process — data entry mistakes, missed deadlines, compliance gaps — and estimate their financial impact. Include rework labor, late fees, lost discounts, and any penalties.
Step 3: Factor in Speed Gains
Faster cycle times create value beyond labor savings. Early payment discounts, faster customer response times, reduced inventory holding costs — these are real financial benefits that belong in the ROI calculation.
Step 4: Subtract Automation Costs
Include software subscription fees, implementation costs (internal or consultant), training time, and any ongoing maintenance. For a detailed breakdown of what leading platforms actually charge, see our BPM Workflow Software Pricing Guide 2026.
Worked Example: Accounts Payable Invoice Processing
Stepper provides a detailed, real-world ROI model for an accounts payable team processing 500 invoices per month. This is a textbook high-volume, error-prone, slow-approval process — all three ROI factors are present.
| Cost/Saving Category | Manual Process | Automated Process | Monthly Financial Impact |
|---|---|---|---|
| Labor cost | 125 hours at $30/hr = $3,750 | ~20 hours at $30/hr = $600 | $3,150 saved |
| Early payment discounts (2% net 10) | Missed on most invoices | Captured on 80%+ of invoices | $4,000 gained (on $200K payables) |
| Late fees (1.5% on overdue) | Applied to ~15% of invoices | Eliminated | $3,000 saved |
| Total monthly gain | — | — | $10,150+ |
| Annualized gain | — | — | $121,800+ |
Even with conservative adjustments — cutting the early payment discount capture rate to 50% and reducing the late fee savings by half — the monthly gain still exceeds $5,000. For most mid-market organizations, that translates to full payback on a mid-tier BPA tool within 2–4 months.
Three Quick-Win Processes to Start Your Automation Journey
Not every process is a good candidate for first-wave automation. The best starting points share three characteristics: high volume, clear rules, and measurable before/after states. Here are three processes that consistently deliver fast ROI.
1. Accounts Payable Invoice Processing
As the worked example above demonstrates, AP automation is the highest-confidence quick win. The process is linear — receive invoice, match to purchase order, route for approval, schedule payment — and every step can be measured. Typical time savings: 80–90% reduction in processing time per invoice. What to measure: invoice processing time, error rate, late payment percentage, and early payment discount capture rate.
2. Employee Onboarding and Offboarding
Employee lifecycle processes involve multiple systems — HRIS, IT provisioning, payroll, benefits, access management — and multiple approvers. Manual onboarding takes an average of 5–10 hours per new hire across all involved departments. Automation can reduce that to under an hour. For a company hiring 20 people per month, that represents 100–200 hours of monthly savings. What to measure: time-to-productivity for new hires, IT ticket volume for access requests, and error rate in provisioning.
3. Lead Routing and Follow-Up
Sales teams lose deals when leads sit unassigned or follow-up is delayed. Automated lead routing — assign based on territory, product interest, or lead score — and scheduled follow-up sequences can increase conversion rates by 10–30%. For a detailed comparison of CRM-native vs. standalone automation platforms for sales workflows, see our Sales Workflow Automation 2026 guide. What to measure: lead response time, lead-to-opportunity conversion rate, and revenue influenced by automated follow-up.
For each of these processes, the key is to measure the before state rigorously before you automate. Without a baseline, you cannot prove ROI to stakeholders. If you are unsure which platform fits your team size and complexity, our team size guide can help you narrow the options.
Common Pitfalls That Delay or Destroy ROI
Understanding why automation initiatives fail is as important as understanding why they succeed. The data reveals several recurring patterns that erode or eliminate expected returns.
Pitfall 1: Automating a Broken Process
McKinsey research, cited by Stepper, found that 73% of failed automation projects occurred because teams automated a process that was already broken. Automation amplifies existing problems — if your approval workflow has unnecessary steps, automating it just makes bad process run faster. The fix: map and optimize the process manually before you automate. This is called process mining or process discovery, and it should be the first step in any BPA initiative.
Pitfall 2: Integration Challenges with Legacy Systems
According to Gitnux data, 45% of BPA projects face integration challenges with legacy systems. This is especially common in enterprises running on-premise ERP systems, custom databases, or older CRM platforms that lack modern APIs. Before selecting a BPA tool, audit your integration landscape. If your core systems do not support REST APIs or webhooks, you may need an orchestration layer rather than simple point-to-point automation. Our article on workflow orchestration vs. automation explains the difference and when you need the former.
Pitfall 3: The Skills Gap
Gitnux reports that 62% of organizations lack the automation expertise needed for successful BPA rollout. This is not just about technical skills — it includes process analysis, workflow design, and change management. Organizations that invest in training before deployment see significantly higher ROI. The most successful approach is to designate one or two 'automation champions' per department, provide them with a low-code or no-code platform, and let them build expertise incrementally.
Pitfall 4: Inadequate Governance Frameworks
ROI realization is delayed for 31% of organizations due to inadequate governance frameworks (Gitnux, directional data). Without clear ownership, approval processes for new automations, and monitoring standards, automation initiatives become fragmented. Different departments build overlapping or conflicting workflows, creating a new kind of chaos. Establish a center of excellence (CoE) or at minimum a cross-functional steering committee before you scale beyond the first two or three processes.
How to Track and Report Automation ROI to Stakeholders
Building the business case is only half the battle. You also need to measure and communicate the results in a way that resonates with finance, operations, and executive stakeholders. Here is a framework for doing that consistently.
Which Metrics to Track
| Metric | What It Measures | Why It Matters to Stakeholders |
|---|---|---|
| Cycle time per transaction | End-to-end process duration before vs. after automation | Directly maps to speed improvements; easy to visualize |
| Error rate per 1,000 transactions | Frequency of errors requiring manual correction | Quantifies quality improvement and compliance risk reduction |
| Cost per transaction | Total labor + overhead cost divided by transaction volume | The most direct ROI metric; finance teams expect this |
| Employee hours saved per month | Total hours reclaimed from manual work | Translates to capacity and headcount planning |
| Early payment discounts captured | Percentage of eligible discounts actually taken | Direct bottom-line impact; CFOs love this one |
| Late fees incurred | Total penalties paid for missed deadlines | Shows cost avoidance; pairs with discount capture |
Setting Up Before/After Baselines
Measure the 'before' state for at least 30 days before deploying automation. This gives you a statistically meaningful baseline. After deployment, measure the same metrics for 30 days, then compare. The delta is your ROI proof. For processes with seasonal variation (e.g., end-of-quarter billing), measure a full quarter before and after.
Reporting Cadence and Format
For the first quarter after deployment, report monthly. After that, quarterly reporting is sufficient unless a process changes significantly. Use a simple one-page dashboard that shows:
- Before vs. after comparison for your chosen metrics
- Cumulative hours saved and cost avoided
- Payback status (have you recovered the initial investment?)
- Any unexpected benefits or issues discovered during deployment
Present the data in terms stakeholders care about: dollars saved, hours reclaimed, and risk reduced. Avoid technical jargon about triggers, webhooks, or API endpoints. If your automation initiative is successful, the first quarterly report should show positive ROI — and that is the strongest argument for expanding to the next process.
Once you have proven ROI on two or three processes, you are ready to think about scaling. The next step is understanding how to combine no-code workflows with AI agents for more complex, decision-intensive processes. Our article on the two-layer automation stack explains how to build a strategy that scales beyond simple task automation.